Doubters, Believers & In-Betweeners

Despite some early jitters, equity markets rose in August with the MSCI All Country World Index leading the way (+2.5%). The S&P 500 posted a gain of 2.3% while the TSX was 1.0% higher as commodities resumed their downward move. Bonds rosed during the period, with the iShares Core US Aggregate Bond ETF (AGG) climbing 1.5% as yields continue to contract. The selloff in the U.S. dollar has certainly helped prime the risk-on pump. The U.S. Dollar Index (DXY) fell 2.6%, as the second largest weighting in the benchmark, the Japanese Yen, rallied 4.5% against the Greenback.
The stock market advance was by no means smooth. On 05-Aug-24, global markets felt tremors as the Nikkei, Japan’s stock index, fell 12% in a day, leading the S&P 500 to fall 3%, its largest one-day drop in 2024. Many attributed the fallout to the unwinding of the Japanese carry trade. This is a trade that involves borrowing yen at comparatively low interest rates and selling the borrowed yen to acquire U.S. dollar-denominated assets. The payoff is positive when the value of the yen declines and/or the return on the USD assets exceeds the borrowing costs. While the trade has worked wonderfully, the prospects of an appreciation in the yen or higher Japanese interest rates interferes with the money tree. There is no doubt this trade is real, both in terms of its size and potential impact on markets. Nevertheless, movements in the market can rarely be attributed to one “thing”. In this instance, volatility accelerated because of the absence of liquidity that often occurs during the summer. Volatility as measured by the CBOE Volatility Index (VIX) was probing its lowest level since 2018 for most of July, which can skew the odds of a quick reversal. It’s important to understand that liquidity can look artificially plentiful when times are good, but on any sign of trouble it can vanish in an instant. Markets have risen every month but one in 2024 and at these levels and valuation, there is always risk of a pullback. Nonetheless, since 05-Aug-24, the Nikkei and S&P 500 rose 22.9% and 5.0%, respectively.
Commodity prices have been persistently weak, despite supply and trades disruptions, as well as geopolitical risks. The Invesco DB Commodity Index Tracking Fund (DBC) fell 2.1% on the back of West Texas Intermediate (WTI) crude oil’s 4.9% loss. While many claim this weakness is the result of a slowdown in U.S. growth, overlaying the DBC chart with Chinese equities is more telling. China is a major source of global commodity demand and its economy is still reeling from a real estate shock, weak demand and declining manufacturing. The commodity complex is unlikely to turnaround until investor positioning becomes net short, or China’s streak of missed growth targets comes to an end.
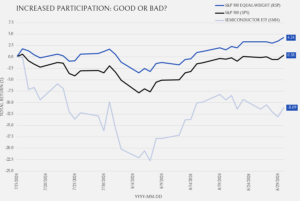
As we look to September and the final four months of 2024, (ignoring the November election which we have no insight on), investors will remain locked-in on the trajectory of the U.S. economy, specifically related to job growth. The Chair of the Federal Reserve, Jerome Powell, all but guaranteed a September cut, so in the absence a major surprise to the upside on jobs or inflation, a 25bp cut is baked-in. Eyes will now focus on how entrenched the Fed will be in the current cutting cycle, and the level they will reach. Certainly, the level is important, but the cause of the aggressive reduction needs to be understood, specifically a rapid loss of jobs or cooling of growth. With valuations still high by any historical standard, capital markets are pricing in significant growth to justify their prices. Accordingly, continued economic momentum will be needed to satisfy these levels. Since stock markets are forward-looking, with prices that reflect what investors think may happen to the economy in the future, we can get some insights from the recent performance. In August, defensive sectors led the way, as Consumer Staples (5.6%), Real Estate (5.1%), Utilities (4.4%) and Healthcare (4.5%) were the best segments. Typically, these shepherd the market in a lowered rate and/or low growth environment. As such, we will continue to be vigilant in evaluating the strength of the U.S. economy, and what that means for assets generally. On a positive note, S&P 500 strength is no longer just a Mag 7 or semiconductor story, as breadth has been in an improving trend. Since the 15-Jul-24 market top, the equal-weight S&P 500 Index has materially outperformed both the S&P 500 and Semiconductors. A lack of breadth was pointed to by doomsdayers as a reason to be bearish for much of the past two years of gains, so we will soon see if increased participation lately is a positive or negative sign.


