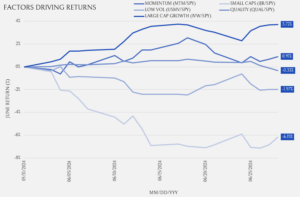
Large Caps Shine On

The theme for the month of June was dispersion. The S&P 500 produced a 3.5% gain while the Canadian Benchmark (S&P/TSX) experienced a 1.5% drop, despite a period when oil was up decidedly. The MSCI All Country World Index split the difference, rising 2.6%. Oil bucked its year-to-date downtrend to rise 5.1% in June. Interestingly, the rebound occurred without any related strong fundamental news. Inventory data provided by the U.S. Energy Information Administration (EIA) on 26-Jun-24 observed that crude inventories rose 4.9mm barrels, its largest single accumulation since the end of April. Domestic production in the U.S. remains near all-time highs and OPEC does not appear to be in a hurry to slow production.
Headline economic and market data is often irrelevant, absent a large surprise, for determining future price direction because it is a rear view or a past experience. Whereas, real-time markets are forward-looking, meaning that they are an expression of what investors think may happen in the future. But, when price moves in opposition to the data, things can get interesting. Accordingly, with oil bouncing off key support levels, a follow-through to the upside could be a potential signal that key economic data like inflation will be triggered higher. So far, Canadian energy stocks are indicating that the surprise surge in oil prices is unsustainable. The iShares S&P/TSX Capped Energy Index ETF (XEG) fell 4.9% in June.
Elsewhere in commodities, weakness across the metals complex, combined with a pause in agricultural commodities, pushed the Bloomberg Commodities Index down 2%. Gold ended the month flat, despite softness in silver, copper, palladium and platinum, Moreover, U.S. Dollar as measured by DXY, strengthened 0.9% this month, As such, gold’s resiliency was impressive. There has not been a lot on the data-front to justify the upward move in the U.S. dollar which is just 0.8% below its year-to-date high. Sudden enthusiasm for the greenback should be observed carefully in the context of gauging liquidity conditions and the appetite for risk assets.
Don’t look now but bonds have now strung together two consecutive monthly gains, as the iShares 20+ year treasury bond ETF (TLT) was up 2.5% in June. Despite all the negative sentiment around bonds and a “higher-for-longer” narrative, the 10-year Treasury Yield has yet to breach its Oct-23 high of 5.02%, settling at 4.35% in June. Yields across the curve exhibited similar patterns, driven mainly by growth and inflation data that has failed to exceed the market’s lofty expectations established during the first half of the year.
The Citi Economic Surprise Index published by Citigroup measures several U.S. economic numbers against economist expectations. It has now been in negative territory for the longest period since early 2023, possibly indicating that the U.S. economy’s extended vigour is starting to show some slack. Additionally, we are also beginning to identify some impact of increased rates filtering into U.S. housing data. Monthly census data showed residential housing construction was weaker-than-expected, as building permits dropped 4% (versus expectations for a 1% gain) and homes started fell 6% compared to an anticipated expansion of 1%. While single family data diverged from the multifamily data in the previous months, both were weak in June, causing the annualized housing starts to be in a defined downtrend. It would be distressing for housing supply if new home builds entered a chronic slump, because inventory across the country is already limited, driven by the reluctance of U.S. homeowners to sell a sub 2% mortgage to purchase a home at current rates.
We’ll close this recap on the dispersion phenomenon. The chart below highlights monthly returns across several factors, clearly showing that the one primary driver of a positive return was size. Large cap growth as a factor exceeded the return of the S&P 500 by 3.7% in June. Similarly, the large-cap tech heavy Nasdaq returned 7.1% while the Dow Jones Industrial Average rose just 1.1%. Apple, Microsoft, Nvidia and Google have broken-out to the upside or hit all-time highs. With July getting started, recent trends point to a continuation of this pattern as the S&P 500 has not registered a down July in 9 years, while the Nasdaq has gone 16 years straight without a down July.


